Customer Engagement Score usually comes up in software conversations, things like login frequency or feature adoption. But the same math applies to loyalty programs, incentive programs, and rewards platforms across distribution, media, and vacation ownership. A member who redeems rewards regularly is behaving a lot like a SaaS user who logs in every week.
This article breaks down what CES actually measures, how it's calculated, and how businesses running loyalty or incentive programs can use it to cut churn and grow revenue.
Key Takeaways
- CES turns scattered customer behaviors into one trackable number showing engagement over time
- Unlike satisfaction surveys, CES reflects ongoing actions, not a single moment's opinion
- Rising scores flag upsell and referral opportunities; falling scores flag churn risk
- The score only creates value when it's reviewed regularly and acted on
What Is a Customer Engagement Score?
CES is a single number built from weighted customer behaviors. It reflects how deeply and how often someone interacts with a brand, product, or program. Instead of guessing whether a customer is happy, you get a data point that tracks their actual actions.
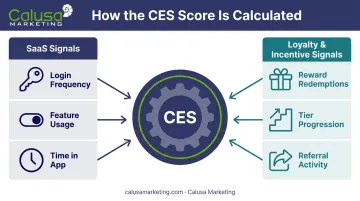
In SaaS, that means login frequency, feature usage, and time spent in-app. In loyalty and incentive programs, the equivalent behaviors look like:
- Reward redemption frequency
- Points or tier progression
- Repeat participation in promotions or campaigns
- Referral or advocacy activity
The logic stays consistent no matter the industry: frequent, valuable interaction signals a healthy relationship. A distributor's dealer rewards program and a media company's subscriber loyalty program are tracking the same underlying pattern, just with different reward types attached.
Here's the part that gets missed. CES only matters when it drives an outcome: retention, upsell revenue, or proof of a program's ROI to leadership. A number that sits in a dashboard and never triggers action is just a report, not a strategy.
Key Advantages of CES
The advantages below focus on outcomes that customer success, marketing, and program managers already track, not abstract theory. Each one ties CES back to a KPI someone in your organization is accountable for.
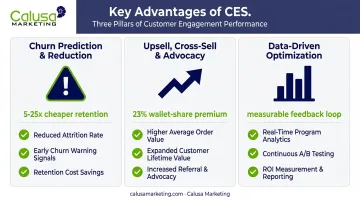
Predicting and Reducing Churn Risk
CES flags disengaged customers before they cancel a subscription or stop participating in a program. Declining login frequency, fewer purchases, or a drop in reward redemptions all show up as early warning signs, long before a cancellation notice hits your inbox.
This matters because catching disengagement early means you can send targeted win-back outreach instead of scrambling with a reactive discount after someone's already checked out mentally.
McKinsey's research on AI-powered retention found that one APAC telecom company using next-best-experience decisioning reduced churn by 5% and nearly quadrupled its retention ROI. A US airline saw a 210% improvement in targeting at-risk customers using similar engagement signals.
For teams managing hundreds or thousands of accounts, this early-warning system lets customer success and account managers prioritize their limited outreach time where it counts, on the customers most likely to leave.
KPIs impacted:
- Churn rate
- Customer retention rate
- Customer lifetime value (CLV)
- Reactivation and win-back rate
This advantage matters most for subscription businesses and any loyalty or incentive program built around renewal cycles. Losing a member you spent months acquiring is expensive to replace.
Identifying Upsell, Cross-Sell, and Advocacy Opportunities
High CES scores point to customers who are already getting real value and might be ready for a premium tier, an additional product, or a referral ask. Engagement data, such as reward redemption frequency, spend patterns, and feature depth, reveals expansion points that sales and marketing teams can act on directly.
Targeting engaged customers converts at a much higher rate than cold outreach ever will. Gallup's customer centricity research found that fully engaged customers deliver a 23% premium in share of wallet, profitability, and revenue growth compared to the average customer. That premium compounds across your entire member base, turning small engagement gains into significant revenue impact.
The practical upside: existing engaged customers are simply easier and cheaper to convert than new prospects, which lowers your overall cost of sales while growing revenue per customer.
KPIs impacted:
- Average revenue per customer
- Upsell/cross-sell conversion rate
- Referral or advocacy rate
This advantage carries the most weight for businesses running tiered loyalty or incentive programs, or any company with multiple products or services to cross-sell across an engaged member base.
Enabling Data-Driven Program and Product Optimization
CES condenses dozens of scattered behaviors into one trackable number. That makes it possible to see, in real terms, whether a change to onboarding, support, or program design actually moved the needle.
Say a program manager rolls out a new reward tier or reworks the onboarding flow for new members. Comparing CES trends before and after that change isolates what genuinely drives engagement versus what just felt like a good idea in a meeting.
This replaces guesswork with a measurable feedback loop. It's a discipline any team managing a loyalty or incentive program can apply, whether the change is a new redemption threshold, a simplified sign-up process, or an updated points structure.
KPIs impacted:
- Program ROI
- Reward adoption rate
- Time-to-value
- Correlation with NPS
This has the highest payoff when you're running multiple concurrent programs or testing new incentive structures across a large member base, since even small engagement shifts compound across thousands of participants.
What Happens When CES Is Missing or Ignored
Skip engagement scoring, and a few predictable problems creep in:
- Inconsistent results. Engagement efforts turn into guesswork with no way to measure what's actually working.
- Misdirected targeting. Teams spend resources courting already-loyal customers while at-risk ones churn without anyone noticing.
- Reactive firefighting. Disengagement only becomes visible after a cancellation or complaint, not before.
- Rising costs over time. Replacing churned customers costs far more than retaining engaged ones, a gap the HBR research put at 5 to 25 times, depending on the study.
- Scaling problems. Without a scorable system, personalized engagement can't extend beyond the handful of accounts one person can track by memory.
None of this is catastrophic on day one. It's the slow accumulation of missed signals that eventually shows up as a churn problem nobody saw coming.
How to Get the Most Value from CES
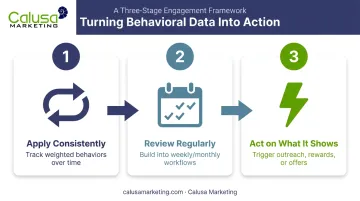
CES only pays off when it's applied consistently, reviewed on a schedule, and actually acted on. A score calculated once and filed away is just a number.
- Apply it consistently. Track the same weighted behaviors over time, not one-off snapshots. Trends tell you far more than a single data point ever will.
- Review it regularly. Build CES checks into weekly or monthly team workflows so at-risk and high-potential customers get caught in time to act.
- Act on what it shows. Pair scoring with a system that can trigger the next step automatically, whether that's outreach, a reward, or a personalized offer.
That third step is where a lot of programs stall out. Cloud-based platforms, including the reward system that Calusa Marketing builds for loyalty and incentive programs, track member engagement, redemption activity, and participation trends. They require no extra integrations or app downloads. That means program managers spend less time wrestling with data pipelines and more time turning scores into action.
Conclusion
CES matters because it brings clarity and structure to a part of the customer relationship that usually stays invisible until something goes wrong. Track engagement continuously, and churn prevention, upsell identification, and program optimization all start to compound instead of happening in isolation.
Treat CES as an ongoing part of managing a program rather than a report you generate once and file away. Whether you're running a dealer rewards program or a customer loyalty initiative, partnering with an experienced incentive provider can help turn those scores into measurable, repeatable results.
Frequently Asked Questions
How do you calculate a customer engagement score?
Identify key engagement events, assign each a weight based on business value, then sum the weighted occurrences into one score. Most platforms automate this calculation for you.
What are the KPIs for customer engagement?
Common KPIs include interaction frequency, feature or reward redemption depth, retention or renewal rate, and referral rate. Together, these show both how often and how deeply customers engage.
What is considered a good customer engagement score?
There's no universal benchmark number. Scores are best judged against your own historical trends and segments, such as comparing your top quartile of customers to your bottom quartile.
What is the difference between customer engagement and customer satisfaction?
Engagement measures ongoing behavior and loyalty over time. Satisfaction measures sentiment at a single point, usually right after a purchase or interaction.
How often should a business review its customer engagement score?
Weekly or monthly, built directly into existing team workflows. A one-time check misses the trends that make CES useful in the first place.
Can customer engagement scores be applied to loyalty and incentive programs, not just software?
Yes. Redemption frequency, reward tier progress, and program participation serve as the loyalty-program equivalent of feature usage in SaaS. They track the same underlying engagement patterns.