Sales performance is the output. Sales performance management (SPM) is the system that produces it.
That distinction matters more than it sounds. Without a real SPM framework, sales organizations tend to lean on "hero selling," where a handful of top reps carry the number while everyone else scrapes by on inconsistent process. The Sales Management Association's own maturity model actually names this pattern: it ranks "Ad Hoc (Chaos)" as the lowest tier of sales-process maturity, defined as having no consistent framework for planning to win deals.
This guide breaks down what SPM actually is, the pillars that hold it together, how to measure it, and what to do to improve it across your entire revenue engine.
Key Takeaways
- Sales performance is the result; SPM is the system that produces and improves it.
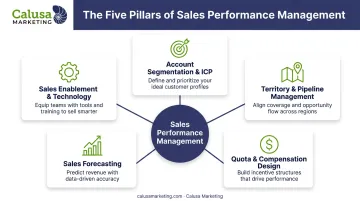
- Five pillars drive SPM: segmentation, pipeline management, quota design, forecasting, and enablement tech.
- Leading indicators like pipeline activity and lagging indicators like revenue both matter, and neither works alone.
- Coaching tied to real deal data beats one-off training and short-term contests.
- Executives, sales ops, and finance each use SPM data for different, critical decisions.
What Is Sales Performance Management?
Sales performance management is the ongoing process of planning, tracking, analyzing, and optimizing how effectively a sales organization converts effort into revenue. It's not a single report on quota attainment, and it's not a dashboard you check once a quarter.
SPM is a system built from several moving parts working together:
- Goal-setting and quota design
- Compensation and incentive structure
- Forecasting methodology
- Coaching and enablement
- The technology stack that ties it all together
One caveat worth flagging: some vendors and industry commentators use "SPM" loosely as shorthand for sales metrics or reporting tools. That's imprecise. Metrics are an input to SPM, not the whole discipline.
What Is Sales Performance?
Sales performance is the effectiveness with which an individual, team, or organization achieves its sales objectives over a set period. It balances quantity (activity volume, calls, meetings, proposals) with quality (deal value, relationship strength, retention).
Why does the distinction matter at scale? Because the gap between where an organization actually lands and where it strategically targets to land is a diagnostic tool, not just a scoreboard. A widening gap tells leadership something specific is off, whether that's rep behavior, a broken process step, or a shift in the market itself.
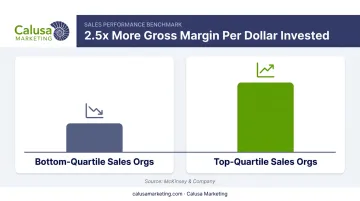
The stakes are real. McKinsey's analysis of nearly 500 B2B companies found that top-quartile sales organizations generate roughly 2.5 times more gross margin per dollar invested in sales than those in the bottom quartile. That gap traces back to broken systems and processes, not a shortage of talent, and closing it is exactly what SPM is designed to do.
The Core Pillars of Sales Performance Management
High-performing sales organizations don't rely on individual talent to carry the number. They build a repeatable framework of interconnected pillars that work whether or not your best rep is having a good quarter.
Account Segmentation and Ideal Customer Profile (ICP)
A clearly defined ICP focuses rep effort on accounts most likely to buy, and buy well. Instead of chasing every inbound lead equally, reps prioritize based on fit signals: firmographics, buying behavior, past win patterns.
The payoff shows up in two places: higher win rates, because effort concentrates where probability is already strongest, and lower customer acquisition cost, since fewer resources get burned on poor-fit prospects.
Organizations that skip this step often discover their reps are spending disproportionate time on accounts that will never convert.
Territory Planning and Pipeline Management
Balanced territories prevent burnout and keep quota expectations realistic. When one rep inherits an overloaded patch while another coasts, motivation and output both suffer.
Pair territory design with sales velocity tracking, meaning how fast deals move through each pipeline stage, and you get visibility into exactly where deals stall. That's far more useful than a generic "pipeline looks healthy" gut check.
Quota, Compensation, and Incentive Design
Transparent, data-backed quotas paired with well-structured incentives keep reps aligned with company goals instead of guessing at what "good" looks like. But designing incentive structures that actually motivate, rather than gathering dust in a policy doc, is its own specialty.
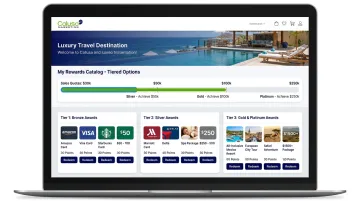
This is why many organizations partner with dedicated incentive marketing firms instead of building reward programs in-house. Calusa Marketing, for example, works with distribution and channel-heavy businesses to design tiered reward structures around quota milestones:
- Digital gift card catalogs with 100+ retail options for hitting 100% of quota
- Incentive travel packages worth $500 to $25,000 for top individual performers
- Group trips scaling up to 10,000 people for company-wide recognition
The real value is removing the operational lift of designing and fulfilling these rewards internally.
Sales Forecasting
Accurate forecasting turns sales from guesswork into something closer to a predictable science. When forecasts hold up, they inform real business decisions: hiring plans, budget allocation, board commitments.
When they don't hold up, everything downstream gets built on shaky ground.
Sales Enablement and Technology
CRM systems, AI-driven insights, and automation exist to reduce time reps spend on administrative work. That matters because the time reps aren't selling is time competitors are.
Salesforce's 2023 research surveying more than 7,700 sales professionals found reps spent only 28% of their week actually selling, with the remaining 72% consumed by non-selling tasks like data entry and internal admin. Enablement technology exists specifically to claw that time back.
How to Measure Sales Performance
Measurement starts with understanding two categories of indicators, and leaders need both.
Lagging indicators tell you what already happened: revenue, quota attainment, closed-won deals. Leading indicators tell you what's likely to happen: pipeline activity, meeting volume, response times. Relying only on lagging metrics means you find out about a problem after it's too late to fix the quarter.
Core KPIs to Track
- Quota attainment: The percentage of reps meeting or exceeding their assigned targets
- Win rate and conversion rate: The percentage of opportunities and leads that convert into closed deals
- Average deal size: The mean value of closed deals, a signal of whether pricing is holding or slipping into discounts
- Sales cycle length: Time from first contact to close; a lengthening cycle often signals friction in qualification or decision-making
- Pipeline coverage ratio: Open pipeline value compared to quota, with 3x coverage as a common benchmark that shifts by industry and win rate
Why a Centralized Dashboard Matters
Tracking these KPIs across spreadsheets, individual CRMs, and manager notes creates blind spots. A centralized sales performance dashboard puts leading and lagging metrics side by side, visible in real time across reps, teams, and leadership.
That visibility is what lets a VP of Sales spot a stalling pipeline in week three of the quarter, not week eleven.
Strategies to Improve Sales Performance Management
Once the pillars and metrics are in place, the real work is continuous improvement.
Coach with real deal data, not generic workshops. A Sales Management Association study of 99 firms employing more than 9,000 managers found that firms providing optimized coaching saw annual revenue growth 16.7% greater than firms offering none.
Yet the same study found managers spent under 8% of their workload coaching. Most organizations are leaving this lever largely untouched.
Remove pipeline friction. Align sales and marketing on lead quality definitions so reps aren't chasing leads that were never sales-ready. That alignment alone accelerates deal velocity without adding headcount.
Build a culture of recognition, not a rotating contest calendar. Short-term sales contests spike activity briefly, then fade. Sustainable motivation looks different:
- Points-based loyalty programs that accumulate value over months, not days
- Tiered reward catalogs tied to quota milestones rather than a single grand prize
- Ongoing recognition programs, like an annual President's Club trip, that reset and grow year over year
Calusa Marketing specializes in this exact function. Instead of internal teams building and fulfilling reward logistics themselves, Calusa handles the full back end, from gift card distribution to travel booking and confirmations. Recognition programs then run continuously without adding to an already stretched sales ops team's workload.
Break down the silos. Sales, marketing, and customer success operating independently creates handoff gaps that show up as lost deals and churned accounts. Cross-functional collaboration closes those gaps and protects retention long after the initial sale closes.
Who Uses Sales Performance Management Data?
SPM data doesn't serve one audience. Different teams pull different value from the same numbers:
- Executive leadership uses SPM data to make predictability-driven decisions on hiring, territory expansion, and budget allocation. Without it, these calls become guesswork dressed up as strategy.
- Sales operations and enablement teams use it for process optimization and targeted coaching, replacing generic training with surgical intervention on the specific skill gap in each rep's numbers.
- Finance and RevOps use SPM data to protect margins, verifying compensation plans stay sustainable, incentive structures drive the intended behavior, and payouts align with revenue generated.
Frequently Asked Questions
What is sales performance?
Sales performance is the effectiveness with which an individual, team, or organization achieves its sales targets over a defined period. It balances activity volume with deal quality, meaning both how much a rep sells and how well those deals hold up.
How do you measure sales performance?
Track a mix of leading indicators (pipeline activity, meeting volume) and lagging indicators (quota attainment, win rate, average deal size, sales cycle length). A centralized dashboard that displays both in real time makes the data actionable rather than just historical.
What are the 7 stages of sales?
The traditional sales process includes seven stages: prospecting and qualifying, pre-approach, approach, presentation, handling objections, closing, and follow-up. Stalls or drop-offs at any stage show up directly in your conversion rates and sales cycle length.
What is the difference between sales performance and sales performance management?
Sales performance is the output, the results a rep or team actually produces. Sales performance management is the ongoing system of planning, measuring, and optimizing that drives those results, including quotas, coaching, forecasting, and technology.
What factors most affect sales performance?
Lead quality, market competition, process efficiency, and team motivation or incentive structure are the biggest levers. Weakness in any one area tends to show up first in win rate or sales cycle length.
How often should sales performance be reviewed?
Weekly pipeline check-ins catch near-term risk early. Monthly coaching reviews address individual rep development. Quarterly strategic evaluations should assess whether quotas, territories, and incentive structures still match business goals.