Here's the common trap: many businesses launch a loyalty or incentive program, then track signups and call it a win. Enrollment numbers look great in a slide deck. They tell you almost nothing about revenue, retention, or whether members are actually engaged.
This guide breaks down the KPIs that matter, gives you a ready-to-use tracking template, and covers best practices for turning raw data into decisions you can act on.
Key Takeaways
- Loyalty KPIs split into three buckets: engagement/behavioral, retention, and financial/ROI
- A standardized template (metric, formula, frequency, benchmark, owner) turns spreadsheets into a working dashboard
- Segmenting data by member tier or channel reveals which cohorts drive performance
- The right platform automates this measurement, cutting manual reporting time
What Are Loyalty Program KPIs and Why They Matter
Loyalty program KPIs are the quantifiable metrics that reveal two things: how healthy your program is (engagement, adoption, satisfaction) and how much it's worth financially (revenue lift, ROI, penetration). Without them, you're guessing.
Tracking KPIs matters for three practical reasons:
- Validates the budget. Leadership wants proof the program pays for itself, not anecdotes.
- Flags at-risk members early. Declining engagement or redemption often precedes churn by weeks or months.
- Directs reward spend. Data shows which incentives actually change behavior, so budget goes where it works.
Consider the scale here. McKinsey's 2024 analysis found that roughly 75% of US households were Amazon Prime members as of 2023, with Prime Day sales climbing from under $1 billion in 2015 to nearly $13 billion in 2023.
That's one paid-loyalty ecosystem, built on data Amazon tracks obsessively. The lesson scales down: whatever the size of your program, the metrics you monitor determine how much value you capture.
Essential Loyalty Program KPIs to Track
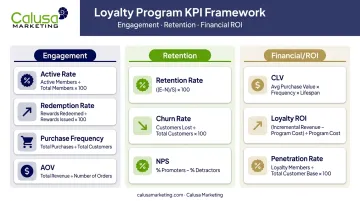
Not every metric deserves equal attention. These nine KPIs, organized into three categories, cover the full picture from daily behavior to bottom-line impact.
Engagement and Behavioral KPIs
These metrics answer a simple question: are members actually using the program?
- Active/Engagement Rate — the percentage of enrolled members who interact with the program (purchase, log in, redeem) in a given period. Formula: active members ÷ total enrolled members × 100. This number separates real value from inflated signup counts. Define your qualifying action and time window clearly, since there's no universal standard for "active."
- Redemption Rate — points or rewards redeemed divided by points issued. High rates signal relevant, accessible rewards; low rates point to friction (confusing redemption process) or unappealing offers.
- Purchase Frequency — total orders divided by unique customers over a period. This tells you whether the program is building actual repeat-purchase habits, not just one-time enrollment.
- Average Order Value (AOV) — total revenue ÷ number of orders. Comparing member AOV against non-member AOV isolates the incremental spend lift the program creates.
Retention and Loyalty KPIs
Engagement gets members using the program. Retention tells you whether they stick around.
- Customer Retention Rate: ((customers at period end − new customers acquired) ÷ customers at period start) × 100
- Churn Rate: customers lost during period ÷ customers at period start × 100
Harvard Business Review reported in 2014 that acquiring a new customer can cost 5 to 25 times more than retaining an existing one, depending on industry and study. That figure is dated, but the logic still holds: keeping the members you have is almost always the cheaper play.
Net Promoter Score (NPS) rounds out this bucket. Members answer a 0-10 recommendation question: 9-10 are Promoters, 7-8 Passives, 0-6 Detractors. NPS equals the percentage of Promoters minus Detractors. It predicts advocacy intent rather than completed referrals, so treat it as a leading indicator, not a revenue metric.
Financial and ROI KPIs
This is where you connect program activity to dollars.
- Customer Lifetime Value (CLV): average purchase value × average purchase frequency × average customer lifespan. Use this to set a ceiling on acceptable acquisition or reward spend per member.
- Loyalty Program ROI: (incremental revenue − program cost) ÷ program cost. "Incremental" is the key word: you need a control group or holdout segment to isolate revenue the program actually caused, not revenue that would have happened anyway.
- Sales/Loyalty Penetration Rate: the share of total sales coming from loyalty members. Antavo's loyalty research reports loyalty members generating 44.8% of total sales across surveyed programs. Treat that as useful context, not a target, since it's a vendor-reported aggregate rather than a validated benchmark.
Building a Loyalty Program KPI Tracking Template
A spreadsheet full of numbers isn't a strategy. A template turns those numbers into something a team can actually act on.
Core Columns Every Template Needs
Build your tracker with these fields:
| Column | Purpose |
|---|---|
| KPI Name | What you're measuring |
| Formula | Exact calculation, no ambiguity |
| Data Source | Where the number comes from |
| Tracking Frequency | How often it's reviewed |
| Target/Benchmark | Realistic goal for this metric |
| Actual Result | Current performance |
| Owner | Who's accountable |
Setting benchmarks: base targets on your own program's maturity and historical performance first, industry averages second. A six-month-old program shouldn't be judged against a five-year veteran's numbers.
Recommended cadence:
- Weekly: operational metrics like redemption and engagement rate
- Monthly: health metrics like active rate and churn
- Quarterly/Annually: financial metrics like ROI and CLV
Segment everything. Break results down by member tier, acquisition channel, or customer type. A blended average can hide the fact that your top tier is thriving while a bottom tier is quietly churning out.
Here's a sample row in action:
- KPI Name: Redemption Rate
- Formula: Points Redeemed ÷ Points Issued
- Data Source: Loyalty Platform
- Tracking Frequency: Monthly
- Target/Benchmark: 60%
- Actual Result: 54%
- Owner: Program Manager
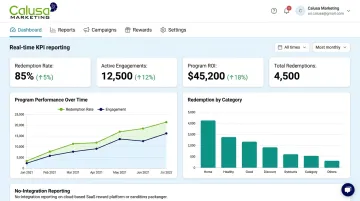
Maintaining this manually in a spreadsheet works fine for a small pilot program. It gets messy fast once you're managing multiple tiers, channels, and thousands of members. This is where a platform like Calusa Marketing's cloud-based SaaS reward system earns its keep. It generates real-time reporting across these exact KPIs, with no integration work or app download required on the client's end.
Best Practices for Monitoring and Acting on Loyalty KPIs
Collecting data is the easy part. Acting on it is where most programs fall short.
- Review consistently, and always segment. Break results into new versus returning members, and high-value versus low-value cohorts, before drawing conclusions.
- Benchmark against your own history first. Compare current performance to last quarter and last year, then validate changes with A/B testing before rolling them out program-wide.
- Treat measurement as a starting point, not an endpoint. McKinsey found that personalization pilots improved gross-margin dollars by 2-4 percentage points compared to mass offers.
That kind of gain only happens when insights translate into reward structure changes, targeted outreach, or win-back campaigns. A dashboard nobody acts on is just a vanity exercise with extra steps.
Why the Right Loyalty Partner Simplifies KPI Tracking
Disconnected systems are the silent killer of good measurement. When redemption data lives in one tool, purchase history in another, and member surveys in a third, decision-making slows to a crawl and true program performance stays fuzzy.
Calusa Marketing built its cloud-based SaaS reward platform to remove that friction. There's no integration to build and no app for members to download. Built-in dashboards track program performance in real time:
- Member engagement and activity levels
- Redemption rates across reward types
- Overall program participation trends
This shifts the reporting burden off internal teams that already have enough on their plates.
For Hajoca, Calusa designed a custom program built specifically around sales growth, with KPIs embedded into the program design from day one rather than bolted on afterward. That upfront planning let the distributor track incentive performance against revenue targets from the first day of launch, instead of retrofitting metrics onto an existing structure.
Technology alone doesn't guarantee good decisions, though. Pairing a real-time platform with a team that has managed 1,000+ programs across 500,000+ members means someone is helping you set realistic benchmarks and read trends correctly, instead of reacting to a number in isolation. That combination is a big part of why Calusa maintains a 99% client retention rate.

Frequently Asked Questions
What are the metrics for loyalty programs?
Loyalty metrics fall into three categories: engagement (active rate, redemption rate), retention (churn, NPS), and financial (CLV, ROI). Most programs track a mix of all three rather than relying on a single number.
What are the 3 R's of loyalty?
Retention, Referrals, and Repeat purchases are commonly cited outcomes of a healthy loyalty program, though there's no single standardized industry framework behind the phrase. Each connects to specific KPIs like retention rate, NPS, and purchase frequency.
How often should you review loyalty program KPIs?
Operational metrics like redemption and engagement rate should get weekly or monthly attention. Financial metrics like ROI and CLV make more sense on a quarterly or annual cadence, since they need time to reflect real trends.
What is a good redemption rate for a loyalty program?
Benchmarks vary widely by industry and reward structure, making a universal benchmark impossible to pin down. Both unusually low rates (signaling friction) and unusually high rates (signaling reward costs may be too generous) are worth investigating.
How is loyalty program ROI calculated?
ROI equals incremental revenue minus program cost, divided by program cost. The tricky part is isolating "incremental" revenue, which typically requires a control group or holdout segment for comparison.
How are loyalty program KPIs different from general marketing KPIs?
Loyalty KPIs focus on existing member behavior, retention, and program-attributable revenue. General marketing KPIs tend to measure broader brand awareness or new customer acquisition instead.