That's how disengagement usually works. It builds quietly for months before it shows up as a resignation letter, a missed deadline, or a team that stops volunteering ideas in meetings.
Engagement isn't a single number you can glance at once a year and forget. It's a blend of what people say (sentiment), what they do (behavior), and what the business sees in return (outcomes). Track only one of those, and you're flying with half a dashboard.
This guide walks through the metrics worth tracking, how to collect them without drowning your team in surveys, and — most importantly — how to turn the data into action that actually moves engagement.
Key Takeaways
- Engagement metrics combine survey data (eNPS), behavioral data (turnover), and outcome data (productivity)
- No single score tells the full story — most teams track 4-6 metrics together
- Top-quartile business units post 23% higher profitability and 18% higher sales productivity than bottom-quartile units, per Gallup's Q12 meta-analysis
- Collecting data without acting on it erodes trust more than not measuring at all
What Are Employee Engagement Metrics?
Employee engagement metrics are the quantitative and qualitative measurements used to gauge how connected, motivated, and committed employees feel toward their work and their organization. They cover everything from a simple survey score to how often someone volunteers for a stretch project.
Here's where most companies get tripped up: engagement and satisfaction are not the same thing.
| Concept | Focus | Example |
|---|---|---|
| Satisfaction | External conditions | Pay, benefits, work environment |
| Engagement | Intrinsic motivation | Discretionary effort employees choose to give |
Gallup makes the distinction clear: a satisfied employee can still be coasting. An engaged one is invested in outcomes, not just conditions. That's why measuring satisfaction alone gives HR teams an incomplete, sometimes misleading picture.
The stakes are larger than most leadership teams realize. Gallup estimates that low engagement cost the global economy roughly $10 trillion in lost productivity in 2025 (about 9% of global GDP), as worldwide engagement held near 20%. That's not an abstract HR problem. It's a line item hiding inside your P&L.
Top Employee Engagement Metrics to Track
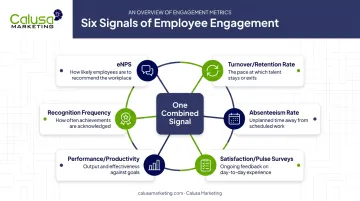
No single metric captures engagement on its own. Combine five or six of the following, and you get a signal you can actually trust.
Employee Net Promoter Score (eNPS)
Ask employees one question: "How likely are you to recommend this company as a place to work, on a scale of 0-10?"
- Promoters: score 9-10
- Passives: score 7-8
- Detractors: score 0-6
eNPS = % Promoters − % Detractors
There's no universally agreed "good" number (benchmarks vary by industry), and Gartner has cautioned that eNPS shouldn't be treated as a standalone KPI. Use it as one input among several, not the whole scorecard.
Employee Turnover and Retention Rate
Turnover rate = (total separations ÷ average headcount) × 100
Retention rate = (employees remaining at period end ÷ employees at period start) × 100
Not all turnover is equal. The U.S. Bureau of Labor Statistics distinguishes voluntary quits (employee-initiated) from layoffs and discharges (employer-initiated). Voluntary turnover is the sharper disengagement signal: it means people are choosing to leave, not being let go.
Absenteeism Rate
The BLS calculates absence rate as (workers with absences ÷ total full-time employment) × 100. A related "lost worktime" rate divides hours absent by hours normally scheduled.
Why it matters: Gallup's meta-analysis found top-quartile engaged business units had 78% lower absenteeism than bottom-quartile units. When absence rates creep up, it's often burnout or disengagement showing up before someone quits outright.
Employee Satisfaction and Pulse Survey Scores
Pulse surveys are short, frequent check-ins (often 5-10 questions), compared with longer annual "climate" surveys. Qualtrics recommends a 70:20:10 mix of driver questions, outcome questions, and open-text feedback.
Watch for these warning patterns:
- Declining response rates over time
- Neutral or "3 out of 5" clustering (indicates disengagement, not satisfaction)
- Consistent negative scores on the same driver question across cycles
Performance and Productivity Metrics
Output per employee, quality of deliverables, and goal attainment rates all correlate with engagement, but they're lagging indicators: they confirm a trend rather than predict one. Gallup's research found engaged units posted 18% higher sales productivity and 14% higher production productivity than disengaged ones. Use these numbers to validate what your survey data is already telling you.
Recognition Frequency and Peer-to-Peer Recognition
How often do employees give and receive recognition? This is one of the strongest leading indicators available. Gallup found that only one in three U.S. workers strongly agreed they'd received recognition in the past seven days, and employees who rated their manager as a strong recognizer were over 40% more engaged.
Tracking recognition frequency means monitoring:
- Recognitions given per employee, per month
- Time between an achievement and the recognition for it
- Participation rates in peer-to-peer recognition tools
This is exactly the metric that structured recognition programs are built to move. Calusa Marketing, for example, designs done-for-you reward and recognition platforms that give HR teams a systematic way to increase recognition frequency without building a program from scratch.
How to Measure Employee Engagement: Proven Methods
Measurement methods fall into four buckets: surveys, conversations, group discussions, and behavioral data. The strongest programs don't pick one; they blend all four.
Engagement Surveys: Annual vs. Pulse
Annual surveys go deep, mapping the full range of engagement drivers once or twice a year. Pulse surveys check in more often (monthly or quarterly) to catch shifts before they become trends. Gallup itself recommends re-administering its Q12 survey roughly every six months to track progress against a baseline.
One-on-Ones and Stay Interviews
Exit interviews tell you why someone already left. Stay interviews ask current top performers what keeps them engaged and what might push them out the door, while there's still time to act.
Best practice: managers should listen for roughly 80% of the conversation, resisting the urge to explain or defend.
Focus Groups
Focus groups take survey results and ask "why." A facilitator walks a representative group (mixed by department, tenure, and role) through specific findings to surface context numbers alone can't provide. Groups of 8-10 employees work best, keeping the discussion focused without silencing quieter voices.
Behavioral and Digital Engagement Data
Passive signals fill the gaps between surveys:
- Training and development participation
- Internal collaboration tool activity
- Optional event or town hall attendance
- Recognition or incentive program participation
SHRM cautions against invasive tracking like keystroke monitoring. Stick to aggregated, transparent, job-relevant data, not surveillance.
Turning Engagement Metrics into Action
Collecting data without acting on it is worse than not measuring at all. Employees notice when they fill out a survey and nothing changes. The next survey gets lower response rates, and the cycle compounds.
Two immediate actions help close that gap before momentum stalls:
- Segment the data by department, tenure, and manager rather than treating scores as one number — a company-wide eNPS of +20 can hide a department sitting at -30.
- Close the feedback loop by telling employees what you found and what you're doing about it, even if the action is small; silence kills future participation.
Recognition is one of the most direct levers available. A field experiment involving 363 workers found that public recognition boosted subsequent performance by 5.2% to 7.3%, depending on how it was structured. Longer term, Gallup and Workhuman's joint research found well-recognized employees were 45% less likely to have left two years later.
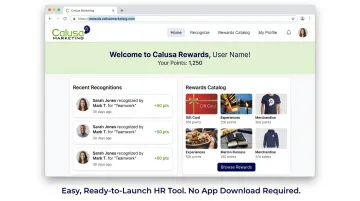
This is where a done-for-you approach helps HR teams move fast once a gap surfaces. Calusa Marketing builds cloud-based reward platforms that require no system integration and no app download — meaning a recognition or incentive program can launch without waiting on IT. For teams that just identified a problem in this quarter's pulse survey, that speed matters more than a perfect long-term rollout plan.
Tools and Software to Track Employee Engagement
Technology should support your engagement strategy, not replace it. A few common categories:
- Pulse survey platforms (like Culture Amp or TINYpulse-style tools) collect sentiment data at scale and track trends over time
- Voice-of-employee solutions aggregate feedback across multiple channels and surface actionable patterns
- Performance management software consolidates goal-tracking and feedback in one place
- Recognition platforms (including digital rewards and loyalty tools like those from Calusa Marketing) formalize peer-to-peer and manager-driven appreciation so it happens consistently, not sporadically
None of these tools fix disengagement on their own. They support a broader strategy built on listening, transparency, and consistent follow-through.
Frequently Asked Questions
What is a KPI for employee engagement?
Common KPIs include eNPS, voluntary turnover rate, absenteeism rate, and satisfaction or pulse survey scores. Each should be tracked against a benchmark or trend over time, not viewed in isolation.
What are the 5 key HR metrics?
Turnover rate, time to hire, absenteeism rate, employee satisfaction/eNPS, and revenue or performance per employee are the most commonly tracked HR metrics across industries.
What is a good eNPS score?
There's no single universal benchmark; context and industry matter. Compare your score against your own historical trend first, and treat eNPS as one input rather than a standalone verdict on engagement.
How often should you measure employee engagement?
Pair frequent pulse surveys (monthly or quarterly) with a deeper annual or biannual survey. Gallup recommends re-running its full Q12 assessment roughly every six months.
What's the difference between employee engagement and employee satisfaction?
Satisfaction reflects external factors like pay and working conditions. Engagement reflects intrinsic motivation and discretionary effort, meaning someone can be satisfied without being engaged.
How can recognition programs improve engagement metrics?
Consistent, structured recognition raises eNPS and retention by making employees feel genuinely valued. Partnering with an incentive marketing firm like Calusa Marketing simplifies program design and fulfillment, helping HR teams launch faster.