Introduction
Every sales team collects data. Few actually use it.
Many sales leaders can tell you last quarter's revenue number but can't explain why one region closed 20% more deals than another, or why a top rep suddenly went cold.
That gap between having data and understanding it is where quota attainment slips, forecasts miss, and good reps quietly disengage.
Sales performance analysis closes that gap. It turns calls, demos, and deal stages into a clear picture of what's driving revenue and what's draining it.
The stakes are real. CSO-led analytics functions are 2.3 times more likely to achieve higher forecast accuracy and 1.8 times more likely to exceed customer-acquisition goals, according to Gartner's 2024 survey of 303 sales leaders.
This guide covers what sales performance analysis involves, the KPIs worth tracking, a repeatable step-by-step process, and how to turn findings into action.
Key Takeaways
- Sales performance analysis turns CRM and activity data into clear answers on what's working
- A handful of KPIs (conversion rate, deal size, cycle length, quota attainment, retention) beats tracking everything
- A repeatable six-step process outperforms a one-time quarterly report
- Insights only pay off when they lead to action: coaching, process fixes, or targeted incentives
What Is Sales Performance Analysis & Why It Matters
What Is Sales Performance Analysis?
Sales performance analysis is the systematic evaluation of sales data, at the individual, team, or organizational level, to measure results against goals and uncover the "why" behind the numbers. It shows up in sales management, revenue operations, executive reporting, and incentive or compensation planning.
There are two ways to approach it: quantitative analysis, which relies on KPIs, dashboards, and CRM reports to show what happened (win rates, deal sizes, quota attainment), and qualitative analysis, which relies on call reviews, coaching notes, and win/loss interviews to explain why it happened.
Neither works alone. A dashboard can tell you conversion rates dropped 8% this quarter. Only a call review tells you it's because reps are fumbling a new pricing objection.
Why It's Critical for Sales-Driven Businesses
Without analysis, sales leaders manage by instinct instead of evidence, and instinct tends to miss warning signs until they show up as a missed quarter.
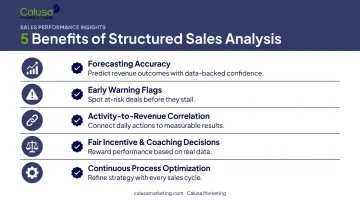
Structured analysis:
- Improves forecasting accuracy and revenue predictability
- Flags underperforming reps, territories, or products before they become bigger problems
- Reveals which activities actually correlate with closed revenue, not just busywork
- Supports fairer, performance-based incentive and coaching decisions
- Enables continuous process optimization instead of reactive fire drills
Key Sales Performance Metrics & KPIs to Track
You don't need forty dashboards to run good analysis. Most teams only need a handful of KPIs, tracked consistently, to answer what actually matters in sales.
| KPI | What It Measures | Why It Matters |
|---|---|---|
| Conversion rate | Percentage of leads or opportunities that become closed deals | Signals pipeline quality; low conversion often means bad-fit leads, not weak selling |
| Average deal size | Average revenue per closed sale | Flags upsell and cross-sell opportunities and pricing trends |
| Sales cycle length | Time from first contact to close | Highlights friction points slowing deals down |
| Quota/target attainment | Percentage of individual or team goals met | The clearest measure of performance against expectation |
| Retention/repeat business | Percentage of customers who buy again | Shows whether growth is sustainable or dependent on new acquisition |
| Sales activity (calls, demos, follow-ups) | Volume of rep-driven touchpoints | A leading indicator that predicts results before deals close |
Quota attainment deserves extra attention. Salesforce's State of Sales report found 67% of reps didn't expect to hit quota, following a year in which 84% missed it entirely.
That's rarely a talent problem. It's usually a sign that upstream metrics, like activity and cycle length, needed attention long before the quota number ever showed up.
One caution: a "good" conversion rate or cycle length varies by industry, price point, and market conditions. Build your own baseline instead of chasing an industry-wide number that may not fit your business.
How to Perform Sales Performance Analysis: Step-by-Step
Sales performance analysis isn't a report you run once a quarter and file away. It's a repeatable process, and most teams stumble in the same three spots:
- Chasing vanity metrics instead of outcome metrics
- Skipping data validation before trusting the numbers
- Stopping at the insight instead of acting on it
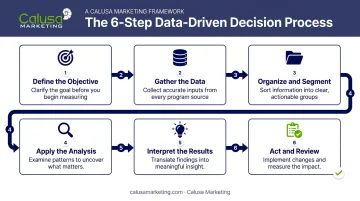
- Define the objective. Decide whether you're evaluating an individual rep, a full team, a product line, or a quarter, and what decision the analysis needs to inform.
- Gather the data. Pull records from your CRM, call logs, deal stages, and revenue reports. Use one source of truth; reconciling three spreadsheets wastes more time than the analysis itself.
- Organize and segment. Clean the data and break it down by rep, region, product, or time period. Aggregate numbers hide the patterns you're actually looking for.
- Apply the analysis. Compare results against targets, historical trends, or peer benchmarks using the KPIs above.
- Interpret the results. Translate numbers into insight. A long sales cycle in one region might point to a pricing objection, not a rep skill gap.
- Act and review. Turn insights into coaching plans, process changes, or incentive adjustments, then set a cadence to check whether they worked.
This mirrors how Harvard Business Review frames it: analytics should drive decisions where there's enough repeatable, relevant data, while judgment still matters for novel or ambiguous situations.
Real-World Example: Sales Performance Analysis Walkthrough
Here's a simplified scenario that plays out across industries, from HVAC distribution to media sales.
A sales team notices quota attainment dropped 15% this quarter. Objective defined: find out why, then fix it. The manager pulls CRM data and call activity logs for the last two quarters.
Organizing the data by rep turns up something unexpected. Two reps have longer-than-average sales cycles, but once they book a demo, their close rate beats the team average.
The common mistake here would be assuming these reps need coaching on selling skills. The corrected interpretation, after reviewing call logs, tells a different story: the bottleneck isn't selling ability, it's delayed follow-up after the initial contact. Leads go cold before a demo ever gets scheduled.
The action: the team introduces automated follow-up reminders in the CRM, plus a short-term incentive rewarding reps who schedule demos within 48 hours of first contact. Incentive programs built around a specific behavior, like the sales incentive structures Calusa Marketing designs for clients, tend to correct problems faster than broad coaching does.
The following quarter, average time-to-demo drops and quota attainment recovers.
That's the pattern worth remembering:
- The metric (quota attainment) flagged that something was wrong.
- Segmented activity data showed where the problem was hiding.
- The qualitative review, watching what reps did day to day, revealed why.
How Calusa Marketing Helps You Act on Sales Performance Insights
Analysis is only half the job. Once it flags a gap, whether that's low activity, slow cycles, or inconsistent quota attainment, someone has to design a program that actually changes behavior. That's where Calusa Marketing comes in, building incentive and loyalty programs around the specific gaps your data uncovers.
Calusa's approach starts with the behavior your analysis identified, not a generic rewards catalog. The process starts by defining the desired behavior: faster follow-up, higher call volume, more consultations completed. From there, it assesses what that behavior is worth to the business and identifies which reps or segments can actually deliver it.
A few things worth knowing:
- 75+ years of combined team experience designing incentive programs tied to sales KPIs like quota attainment and activity volume
- A cloud-based SaaS reward platform with no integration and no app download, so a program can roll out fast once analysis flags a need
- Full-service fulfillment and white-glove support, seven days a week, so sales leaders manage strategy instead of logistics
- 1,000+ programs managed with a 99% client retention rate across sales-driven industries
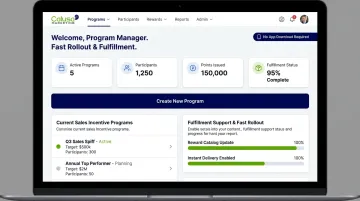
Take Hajoca, an HVAC and plumbing distributor. Calusa built a program centered on sales growth, tailored to the company's own KPIs rather than a one-size-fits-all template.
Consistent analysis paired with a structured incentive program, tied to the exact behavior you're trying to change, is how top teams keep improving quarter after quarter. Schedule a conversation to see how it could work for your team.
Frequently Asked Questions
How do you analyze sales performance?
Define the objective, gather CRM and activity data from a single source of truth, compare results against targets using core KPIs, then interpret and act on what you find. Skipping the "act" step is the most common failure point.
What are the 5 key performance indicators in sales?
Conversion rate, average deal size, sales cycle length, quota attainment, and customer retention or repeat business. Together, these cover pipeline quality, deal value, process speed, and long-term sustainability.
What is sales performance analysis?
It's the process of evaluating sales data at the individual, team, or organizational level to measure results against goals and identify what's driving or limiting performance.
How often should sales performance be reviewed?
Check activity metrics weekly, review core KPIs monthly, and run a deeper analysis quarterly. Reviewing too rarely delays fixes; reviewing everything daily just adds noise.
What tools are commonly used for sales performance analysis?
CRM reporting and dashboards, spreadsheet models for custom analysis, and BI tools that pull data from multiple sources into one view. Most teams use a combination rather than a single tool.
How can incentive programs improve sales performance?
They motivate the exact behaviors your analysis flags, like faster follow-up or higher activity volume, rather than rewarding results alone. Calusa Marketing builds programs around that specific behavior-to-incentive link.