The problem is that most companies still watch one number: overall turnover. That's a lagging indicator. It tells you who left after they're already gone. Tracking the right mix of KPIs instead helps HR teams catch attrition risk early, control replacement costs, and actually prove that retention programs are working.
This article breaks down 12 essential employee retention KPIs for 2026, how to calculate each one, and how to pick which ones matter most for your organization.
Key Takeaways
- KPIs span tenure, satisfaction, cost, and department data, not just turnover.
- Tracking 12 metrics together builds a complete view beyond one lagging number.
- Mercer's 2025 survey puts average U.S. voluntary turnover at 13.0% for 2026.
- Choose KPIs based on industry, headcount, and goals, not a generic checklist.
- Recognition and incentive programs remain among the fastest levers for these numbers.
What Are Employee Retention KPIs and Why They Matter in 2026
Employee retention KPIs are quantifiable measures that track how effectively an organization keeps its workforce over a defined period. They replace gut feelings and hallway conversations with actual data.
That distinction matters more in 2026 than it did five years ago. AI-driven job displacement fears, return-to-office mandates, and shifting Gen Z expectations around flexibility and purpose all make attrition harder to predict without numbers behind it.
The scale of the risk is bigger than most leaders assume: in Q4 2025, 51% of U.S. employees were either actively job hunting or watching for opportunities, according to a 2025 Gallup workplace report. That's a coin flip on any given team.
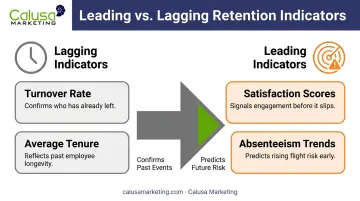
Without KPI tracking, HR reacts to resignations instead of preventing them. Leadership can't tie retention spending to business outcomes because there's nothing to point to. The fix is pairing:
| Indicator Type | Definition | Examples |
|---|---|---|
| Lagging | Confirms what already happened | Turnover rate, average tenure |
| Leading | Flags trouble before someone quits | Satisfaction scores, absenteeism trends |
Together, they form an early-warning system rather than a post-mortem report.
12 Employee Retention KPIs to Measure in 2026
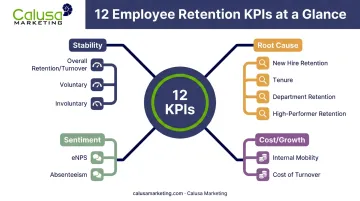
No single metric tells the full story. These 12 KPIs together cover overall stability, root causes, cost impact, and workforce sentiment.
1. Overall Retention Rate
Formula: (Employees remaining ÷ employees at start) x 100
Usually calculated quarterly or annually, this KPI reveals general organizational health. According to Qualtrics, 90% or higher is a common cross-industry benchmark, though acceptable rates vary widely by industry and company type.
2. Overall Turnover Rate
Formula: (Employees who left ÷ average headcount) x 100
Turnover is the inverse of retention, but it's not the same as attrition. Turnover assumes the role gets backfilled; attrition often means the position disappears entirely. Healthy turnover looks different by sector too. BLS data shows 2025 separation rates ranging from 2.9% in health care to 5.6% in leisure and hospitality, so compare against your own industry rather than a flat number.
3. Voluntary Turnover Rate
Formula: (Voluntary departures ÷ average headcount) x 100
This is the number that goes up when compensation, culture, or growth opportunities fall short. Pair it with structured exit interviews. A spreadsheet won't tell you why someone left; a well-run exit conversation will.
4. Involuntary Turnover Rate
Formula: (Terminations and layoffs ÷ average headcount) x 100
Rising involuntary turnover often flags a hiring or onboarding mismatch rather than a discipline problem. Document this data consistently, both for compliance purposes and to spot patterns across departments over time.
5. New Hire Retention Rate
Formula: (New hires still employed at 90 days or 1 year ÷ total new hires) x 100
Low new-hire retention almost always points to onboarding gaps or mismatched expectations set during recruiting. It rarely reflects a deeper culture issue, which makes it one of the easier KPIs to fix quickly.
6. Average Employee Tenure
Formula: Cumulative years employed ÷ total employees
Track this as both a current snapshot and a lifetime average. U.S. median tenure sat at 3.9 years as of January 2024, down from 4.1 years two years earlier, according to BLS data. Short tenure often signals unclear career paths or a lack of recognition along the way.
7. Retention Rate by Department or Manager
Segmenting retention by team, manager, or role uncovers problems a company-wide average will hide completely. This is one of the fastest ways to identify a specific manager or department driving disproportionate attrition before it spreads.
8. High-Performer Retention Rate
This tracks retention specifically among your top-rated or highest-producing employees. Losing a star performer costs far more than average attrition in lost revenue, productivity, and institutional knowledge. Weight this KPI more heavily on leadership dashboards than general turnover.
9. Employee Satisfaction Rate / eNPS
Formula: % promoters − % detractors (scored -100 to +100)
Based on the question "how likely are you to recommend this organization as a place to work?" on a 0-10 scale, eNPS is a leading indicator. It frequently predicts turnover months before employees formally resign.
10. Absenteeism Rate
Formula: (Unplanned absences ÷ total workdays) x 100
This excludes approved PTO on purpose. Rising absenteeism is often an early sign of burnout or disengagement showing up well before a resignation letter does.
11. Internal Mobility / Promotion Rate
Formula: (Internal fills + promotions ÷ total open roles) x 100
Visible career pathing is one of the top reasons employees choose to stay in 2026. SHRM-sourced research found 56.3% of employees wanted clearer promotion pathways as a reason to remain with an employer.
12. Cost of Turnover
Cost of turnover includes both hard costs (recruiting, onboarding) and soft costs (lost productivity, morale hits). Gallup estimates replacement costs around 40% of salary for frontline workers, 80% for technical roles, and 200% for leaders and managers (Gallup, 2024). Use this KPI to build the financial case for retention investment.
How to Choose the Right Retention KPIs for Your Organization
Tracking all 12 with equal intensity isn't realistic for most teams, nor is it necessary. Prioritization should match your company's size, industry, and current pain points.
A few factors to weigh:
- Start narrow. Begin with one lagging indicator and one leading indicator, such as overall retention rate paired with eNPS, before expanding into segmented metrics.
- Align to a business goal. Are you trying to reduce new-hire turnover, or protect high-performer retention? Pick KPIs that map directly to that goal.
- Match your reporting cadence to your ability to act. There's no point reviewing absenteeism weekly if your team can only respond to findings quarterly.
Once those foundational KPIs are stable, layer in department-level and cost-based tracking.
Improving Retention KPIs with Recognition and Incentive Programs
Compensation adjustments help, but they're slow and expensive to move repeatedly. eNPS, tenure, and voluntary turnover often shift faster when paired with structured recognition and incentive strategies instead.
Programs built around rewards, travel incentives, or point-based recognition tend to boost engagement directly, which in turn reduces the disengagement that drives both absenteeism and voluntary exits.
Structured programs like this are where Calusa Marketing specializes. The company builds cloud-based reward platforms designed for exactly this purpose, deploying without an app download or a heavy IT lift.
These programs typically include:
- Digital punch cards for frequent, low-friction recognition
- Gift card fulfillment across 100+ retailer options
- Branded merchandise rewards with global drop-ship delivery
- Incentive travel for individual or group achievement
Contact center clients like Alorica and Inktel use these programs to support agent recruitment and retention. Frontline turnover runs high in that sector, so every percentage point of retention carries real payroll impact.
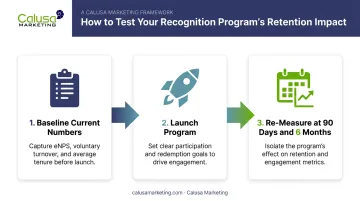
If you're testing a recognition program, track KPI movement before and after launch:
- Baseline your current numbers for eNPS, voluntary turnover, and tenure
- Launch the program with clear participation and redemption goals
- Re-measure at 90 days and 6 months to isolate the program's actual effect
That before/after comparison is what turns a recognition program from a nice perk into a documented retention lever.
Conclusion
No single metric defines retention success. Overall retention rate tells you the headline number, but tenure, eNPS, department-level data, and cost of turnover explain why and what to do next.
Consistent tracking is what turns retention from a reactive HR task into a proactive, data-driven business strategy. Start with three or four core KPIs, get comfortable acting on what they show you, then expand your measurement framework as your retention strategy matures. Platforms like Calusa Marketing's incentive and recognition tools help turn these insights into targeted retention programs that keep top performers engaged.
Frequently Asked Questions
What are good retention metrics?
Strong retention metrics combine overall retention or turnover rate with tenure, eNPS, and new-hire retention. One number alone never tells the full story of workforce stability.
What are the top 3 KPIs for employees?
Most organizations should start with overall retention rate, voluntary turnover rate, and eNPS or employee satisfaction. These three cover the biggest blind spots with the least reporting overhead.
What is a good employee retention rate in 2026?
Qualtrics cites 90% or higher as an anecdotal cross-industry rule of thumb, but this varies significantly by sector and role type. Compare against your specific industry's turnover data rather than treating 90% as universal.
How often should companies review retention KPIs?
Review leading indicators like eNPS and absenteeism monthly. Pair that with quarterly or annual reviews of lagging indicators like turnover and tenure.
What's the difference between retention rate and turnover rate?
They're inverse measures. Retention rate tracks who stays; turnover rate tracks who leaves. Track both together for the full picture.
How can incentive programs improve employee retention KPIs?
Recognition and reward programs boost engagement and satisfaction scores, which are leading indicators. Improvements there typically show up later as better tenure and lower voluntary turnover.