
Here's the common struggle: people leaders invest real time and budget into onboarding, yet when a CFO asks "did it work?" they're stuck guessing. Without data, it's nearly impossible to prove onboarding's impact on retention, productivity, or engagement.
This guide breaks down the metrics that matter, the framework behind a strong onboarding program, and how to turn raw data into decisions that actually move the needle.
Key Takeaways
- Pair hard metrics (time-to-productivity, turnover, cost) with soft signals (surveys, check-ins) for full context
- The 4 C's framework, plus an optional "Check-back" step, makes onboarding easy to measure
- Track 30/60/90-day milestones to pinpoint exactly where new hires disengage
- Recognition tied to onboarding milestones reinforces belonging and speeds up early retention gains
Why Measuring Onboarding Success Matters
Onboarding sets the tone for the entire employee lifecycle. A rocky first few weeks creates a bad first impression that plants the seeds of an eventual exit.
The numbers back this up. According to BambooHR's 2023 onboarding research, 70% of new hires decide whether a job is the right fit within their first month, and 29% make that call within the first week. BambooHR frames this as a 44-day window where employers can still shape long-term retention.
That window closes fast. Waiting until a 90-day review to check in on satisfaction means you've already missed the moment where most people made up their minds.
Tracking onboarding metrics from day one gives HR teams several concrete advantages:
- Spot friction points before they turn into resignations
- Justify budget and headcount for onboarding improvements with real numbers, not anecdotes
- Refine the program continuously instead of relying on a one-time launch-and-forget approach
- Benchmark progress against past cohorts to confirm onboarding investments are paying off
Metrics turn onboarding from guesswork into a repeatable, measurable process.
Essential Metrics to Measure Onboarding Success
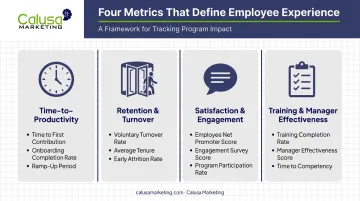
If someone asks "what are examples of success metrics" for onboarding, the answer falls into four buckets: how fast people get productive, whether they stick around, how satisfied they feel, and whether the process itself is being completed as designed.
Time-to-Productivity Metrics
Time-to-productivity measures how long it takes a new hire to reach full performance in their role. SHRM recommends setting position-specific KPIs rather than a single company-wide timeline, since a warehouse associate and a financial analyst simply ramp at different speeds.
To calculate it, average the number of days it takes new hires in a given role to hit their defined productivity benchmark. Gallup notes that, based on its own consulting experience, employees often need around 12 months to reach peak performance, though this is a directional estimate rather than a fixed rule.
Perception varies sharply by who's asked. One SHRM Foundation review found hourly employees considered themselves fully onboard after 3.5 weeks, while their supervisors didn't see them as fully functional until three months. That gap alone is worth measuring.
Shorter ramp times reduce cost, but never sacrifice thoroughness just to hit a number faster.
Retention and Turnover Metrics
New-hire turnover rate is the percentage of employees who leave within a defined window, typically 90 days or one year. Calculate it by dividing new-hire departures by total new hires in that cohort, then multiplying by 100.
Work Institute's analysis of over 123,000 exit interviews found that roughly 40% of all turnover happens in an employee's first year, according to the 2025 Retention Report. That's a huge share of attrition happening in the exact window onboarding is meant to influence.
This is where the "retention threshold" concept helps: the specific point where most of your new hires tend to exit. Some organizations see a cliff at 90 days; others see it closer to six months. Pinpointing your own threshold tells you exactly where the onboarding process is breaking down.
Satisfaction and Engagement Metrics
Surveys at 30, 60, and 90 days give you a structured pulse check. Useful questions include:
- Do you have the resources and tools you need to do your job?
- How welcomed and supported do you feel by your team?
- Is your role matching what you expected during hiring?
- Does your work clearly connect to team goals?
Survey data alone isn't enough. Layer in 360-degree feedback from managers, peers, and onboarding buddies to catch gaps that a form might miss. The payoff is real: Gallup reports that employees who call their onboarding "exceptional" are 2.6 times more likely to be extremely satisfied with their workplace overall.
Training, Completion, and Manager Effectiveness Metrics
Training completion rate tracks the percentage of assigned onboarding tasks a new hire actually finishes. A consistently low rate usually signals one of two things: the content is poorly timed, or there's simply too much of it crammed into week one.
Manager effectiveness deserves its own line item. Track new-hire retention rate by manager to see which leaders are onboarding well and which aren't. According to Gallup's onboarding research, employees are 3.4 times more likely to describe their onboarding as successful when their manager plays an active role.
The 5 C's of Successful Onboarding
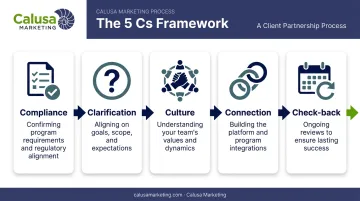
The metrics above don't exist in a vacuum. They're designed to measure a qualitative framework built around what's often called the 4 C's, developed through research by Dr. Talya Bauer for the SHRM Foundation. Many practitioners have since added a fifth element, Check-back, as a practical extension of the original model.
Here's how each piece connects to the metrics you're already tracking:
Compliance covers the legal and policy paperwork: tax forms, handbooks, safety rules. It's the easiest box to check and, on its own, the least impactful. Nobody stays at a job because the I-9 form was filled out correctly.
Clarification ensures new hires actually understand their role, responsibilities, and what success looks like. This ties directly to time-to-productivity. Confusion here is often the root cause of a slow ramp.
Culture immerses people in both the written and unwritten norms of the organization: how decisions get made, how people communicate, what's actually valued day to day. This shapes satisfaction and engagement survey scores more than almost anything else.
Connection builds the relationships new hires need with peers, managers, and mentors. It links directly to retention and turnover data. People rarely quit a job on day one because of the paperwork; they quit months later because they never felt like they belonged.
Check-back rounds things out with ongoing follow-up at 30, 60, and 90 days. This is exactly why milestone surveys matter so much: they catch small issues before they become resignation letters.
Best Practices for Turning Onboarding Data into Action
Collecting metrics is only half the job. Here's how to make the data useful:
- Standardize the process. Use the same milestones, survey questions, and task definitions across every new hire so your metrics are comparable across cohorts.
- Set benchmarks before you measure. Define a target time-to-productivity by role and an acceptable turnover threshold before you start tracking, not after you see the numbers.
- Automate data collection. Manual spreadsheets miss trends. Onboarding software or HRIS dashboards surface patterns in real time instead of after the fact.
- Close the loop. When a survey or turnover report surfaces a recurring issue, assign someone to fix it. Data without ownership just becomes a report nobody reads.
Research on onboarding effectiveness consistently favors structured, supported on-the-job training over ad-hoc approaches, even though the evidence base for onboarding specifically remains limited.
The takeaway: consistency in your process beats improvisation.
Strengthening Onboarding Outcomes with Recognition and Incentives
Metrics tell you where onboarding is breaking down. Recognition helps fix it.
Small, milestone-based incentives, think completing week-one training or hitting the 90-day mark, reinforce two of the C's directly: Connection and Culture. When a new hire gets recognized for reaching a milestone, it signals they're noticed and valued, which is exactly the belonging signal that drives retention.
This isn't just a theory. Gallup's longitudinal study of nearly 3,500 employees found that those who felt well-recognized were 45% less likely to have left their organization two years later, according to Gallup's research on recognition and retention. Employees whose recognition hit at least four of Gallup's five quality markers were nine times more likely to be engaged.
This is where a structured incentive program earns its keep. Calusa Marketing's Employee Recognition solutions are built around this kind of milestone-based motivation, helping HR and people leaders get more new hires through their 90-day introductory period without adding another manual process to an already full plate.
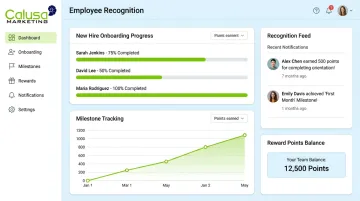
Clients in industries like customer service and media have used similar recognition structures to reinforce onboarding milestones alongside broader retention and performance goals.
The mechanics can flex to fit a company's budget and culture:
- A digital gift card for completing week-one training
- Points toward a rewards catalog at the 60-day mark
- A bigger milestone reward at 90 days
Companies with structured onboarding recognition consistently report stronger retention and satisfaction scores, tying incentive strategy directly to onboarding success.
Frequently Asked Questions
What are examples of success metrics?
Common onboarding success metrics include time-to-productivity, new-hire turnover rate, retention threshold, satisfaction survey scores, and training completion rate. Together, they cover speed, retention, sentiment, and process adherence.
What are the 5 C's of successful onboarding?
The framework covers Compliance, Clarification, Culture, Connection, and Check-back. The first four originate from SHRM Foundation research, while Check-back is a widely used practical addition for ongoing follow-up.
How long should employee onboarding last?
Best practice extends onboarding through the first 90 days at minimum, with some organizations treating a full year as the true integration period. Gallup's research suggests full productivity can take 12 months for some roles.
What is considered a good onboarding completion rate?
There's no universal industry benchmark here since it varies heavily by role and complexity. Consistently low completion rates typically point to content overload or poor task scheduling, not the new hires themselves.
How often should you survey new hires during onboarding?
Survey at 30, 60, and 90 days at minimum, with many companies adding a first-week pulse check and a one-year follow-up. This cadence lines up with SHRM's recommended check-in schedule.
What tools help track onboarding metrics?
HRIS platforms, dedicated onboarding software, learning management systems, and survey tools all play a role. Most companies combine two or three of these to cover task tracking, sentiment, and retention data in one place.